A post following up on the previous one, using James Powell's recently released The Inquisition of Climate Science to illustrate why science communication can't be left entirely to scientists.
Sunday, September 25, 2011
Wednesday, September 21, 2011
Should we leave science communication to scientists?
The answer is no, according to John Beasley and Matthew Nisbet's current article "How scientists view the public, the media and the political process" published in Public Understanding of Science. Here is the abstract:
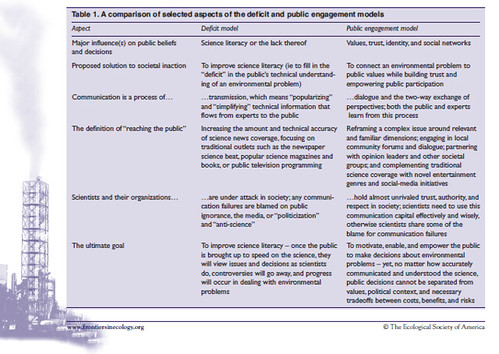
The current post on Nisbet's blog discusses the article further and includes the following informative graphic summarizing the difference between the deficit model (which most scientists accept and practice) and the alternative public engagement model of science sommunication.
We review past studies on how scientists view the public, the goals of communication, the performance and impacts of the media, and the role of the public in policy decision-making. We add to these past findings by analyzing two recent large-scale surveys of scientists in the UK and US. These analyses show that scientists believe the public is uninformed about science and therefore prone to errors in judgment and policy preferences. Scientists are critical of media coverage generally, yet they also tend to rate favorably their own experience dealing with journalists, believing that such interactions are important both for promoting science literacy and for career advancement. Scientists believe strongly that they should have a role in public debates and view policy-makers as the most important group with which to engage. Few scientists view their role as an enabler of direct public participation in decision-making through formats such as deliberative meetings, and do not believe there are personal benefits for investing in these activities. Implications for future research are discussed, in particular the need to examine how ideology and selective information sources shape scientists’ views.
The current post on Nisbet's blog discusses the article further and includes the following informative graphic summarizing the difference between the deficit model (which most scientists accept and practice) and the alternative public engagement model of science sommunication.
Sunday, September 11, 2011
Tea Party, Politics and Global Warming
A special report from the Yale Center for Climate Change Communication, Politics & Global Warming: Democrats, Republicans, Independents, and the Tea Party reports how the members of each political party respond to the issue of global warming. For people who have studied US attitudes toward climate change, most of the results are familiar. However, for the first time, this report separates the views of Tea Party members on global warming from the traditional political categories of Democrats, Republicans, and Independents. So, that's where I'll focus.
As shown in the chart below, Tea Party members are both least likely to believe in global warming and most entrenched in their opinions (feeling that they are more informed and don't need additional information to form their opinion).
 Consistent with the strength of their views, they are less likely to change their view based on empirical experience (i.e., extreme weather; specifically, either the heat wave of the summer or the snowstorms of the winter).
The public is notoriously bad at 'knowledge' questions. For example, the national average is identically split on the level of scientific consensus: 41% say most scientists think global warming is happening and 41% think there is 'a lot of disagreement among scientists'. This is, of course, an empirical issue. One can count up the views of the scientific community as Naomi Oreskes and others have done. No one did particularly well when asked "what proportion of climate scientists think that global warming
is happening?" Only 18% of Democrats and Independents got the right answer (81-100%) while 1% of Tea Party members gave that response. In contrast to all other groups, Tea Party members were more likely to understate the level of consensus (suggesting only 21-40% of climate scientists believed global warming was occurring).
There is a lot more in the report, but, in general, three additional areas stand out:
1) Compared to the rest of the population, Tea Party members are more individualist and less egalitarian in their personal values.
2) Compared to the rest of the population, Tea Party members distrust social institutions and information sources of all types.
3) Despite these fundamental differences, there are some specific climate relevant policies that Tea Party members support in greater numbers than other groups (building more nuclear plants) or hold views generally similar to the rest of the population (funding research into renewable energy, creating bike paths/lanes, increasing availability of public transportation).
In sum, there is a strong and entrenched opposition to the way the climate debate has been framed in the US. The Tea Party members are, and will remain, able to block any 'big government' policy focused on 'global warming.' It is time to reframe the debate in terms of energy and other areas where progress is possible.
As shown in the chart below, Tea Party members are both least likely to believe in global warming and most entrenched in their opinions (feeling that they are more informed and don't need additional information to form their opinion).
The public is notoriously bad at 'knowledge' questions. For example, the national average is identically split on the level of scientific consensus: 41% say most scientists think global warming is happening and 41% think there is 'a lot of disagreement among scientists'. This is, of course, an empirical issue. One can count up the views of the scientific community as Naomi Oreskes and others have done. No one did particularly well when asked "what proportion of climate scientists think that global warming
is happening?" Only 18% of Democrats and Independents got the right answer (81-100%) while 1% of Tea Party members gave that response. In contrast to all other groups, Tea Party members were more likely to understate the level of consensus (suggesting only 21-40% of climate scientists believed global warming was occurring).
There is a lot more in the report, but, in general, three additional areas stand out:
1) Compared to the rest of the population, Tea Party members are more individualist and less egalitarian in their personal values.
2) Compared to the rest of the population, Tea Party members distrust social institutions and information sources of all types.
3) Despite these fundamental differences, there are some specific climate relevant policies that Tea Party members support in greater numbers than other groups (building more nuclear plants) or hold views generally similar to the rest of the population (funding research into renewable energy, creating bike paths/lanes, increasing availability of public transportation).
In sum, there is a strong and entrenched opposition to the way the climate debate has been framed in the US. The Tea Party members are, and will remain, able to block any 'big government' policy focused on 'global warming.' It is time to reframe the debate in terms of energy and other areas where progress is possible.
Tuesday, September 6, 2011
Was there a structural change in the economy in the late 1970s - early 80s?

The lines trace the impact of various recessions on employment. Each color refers to a particular recession. The individual lines trace both the extent of job loss (the deeper the drop, the greater the drop in employment) and the length of time to get back to the pre-recession rate of employment (the further to the right, the longer the recovery takes).
The striking thing about the graph is that something fundamental appears to have occurred around 1980/81. If you look at the lines for the seven recessions that occurred between 1948 and 1980, they all have the same basic V shape. There is also a fairly systematic relationship between the depth of the recession, the length of time until the bottom is reached and the time until employment returns to the pre-recession level. In systemic terms, all recessions up to 1980 behaved in a generally similar fashion.
There is also a noticeable difference between the earlier V shaped recessions and the later ones. The earlier ones (1948, 1953, 1957) have very similar profiles; they were deeper (job losses of 3.4-5.2%) and longer (with 13 months until the bottom) than the later V-shaped recessions. The recessions of 1960, 1969, 1974 and 1980 were shallower (job losses of 1.3-2.7%) and shorter (between 4 and 10 months to the bottom).
The three most recent recessions (1990, 2001, 2007) have a very different profile. Rather than the sharp drop and bounce back of the V shape, the whole process appears to have slowed down. The rate of decline and the rate of recovery are both much slower and the impact of the recession on employment is much longer. The profiles of the three most recent recessions look more like a river basin than the V-shaped valley of the earlier ones. It has taken longer to reach the bottom (24 months, or almost twice as long as the 48-57 recessions) and, once there, the percentage of job losses has flat-lined for close to a year before starting to recover.
The transition appears to have occurred in 1980/81. This is the only case where there is a double-dip recession. Moreover, where the 1980 recession looks like the smallest of the V-shaped recessions, the 1981 curve has a transitional look. Unlike any of the previous recessions, the bottom comes a few months later and flatlines for a few months before the upsurge in employment occurs. The other point of significance. Where recessions had occurred on a crude 5 year cycle up to 1980, the cycle is more like 9 or 10 years since the 81 recession. This, like the shifting shape, suggests the overall process has slowed.
As noted in an earlier post, there are other indicators that the global economy significantly changed at this time, a period linked with the early phases of economic globalization.
So, to take a shot at translating this into panarchy terms, recessions are a product of the adaptive cycle. Over the period from the late 1950's to 1980, US macro-economic policy became better and better at managing recessions. They continued to come at roughly the same frequency, but they were shorter and shallower than the earlier ones. This could, potentially, indicate an increase in rigidity over time as US macroeconomic policy attempted to 'smooth out' the business cycle. This national level process, around 1980, confronted a different dynamic -- resulting from changes to the higher (global) level cycle associated with economic globalization. In other words, the shift from one form of recession (V-shaped) to another (river-shaped) involves a cross-scale interaction where changes in the global economy (outsourcing of manufacturing and the increasing financialization of the US economy, for example) affect the ability of the US to rebound from recessions and, in particular, to create jobs.
Saturday, September 3, 2011
Budget Smog

So, you would think that environmental regulations that would limit air pollution and save billions in healthcare costs would be a good idea. Instead, as described in detail in Obama pulls back proposed smog standards in victory for business, the Obama administration has crumpled in the face of political pressure. Afraid of being labeled as responsible for "job killing regulation" during a period of high unemployment, the move effectively leaves in place 1997 era standards which even the Bush administration admitted were lax and out of date. (The 1997 regulations were based on science showing that low-level ozone and other atmospheric pollutants contributed to various lung disease but not to death. Subsequent research has unequivocally tied such pollutants to both disease and death.)
Significantly, the regulations are, from a macro-economic perspective, effectively neutral. They would cost industry somewhere between $19 and 90 billion per year by 2020 (depending on the precise standard implemented) and would result in between $13 and 100 billion in healthcare savings. In other words, the total level of economic activity would remain the same, there would just be a shift from government expenditures on healthcare to private sector expenditures on pollution control.
Ominously,
The ozone standard is one of several air-quality rules the administration is in the process of adopting or has already finalized that are under attack. Others include new limits on mercury and air toxins, greenhouse gases from power plants, and a range of emissions from industrial boilers, oil refineries, cement plants and other sources.This was the easy one. So the likelihood of action on the others is even less. Inaction on smog turns the big club of unilateral action on carbon emissions that the US courts gave the EPA when they ruled carbon was a pollutant into a plush toy. It is looking more and more like US environmental policy is another casualty of the divisive political culture. Return to slow and costly litigation in the courts may be the necessary path

Subscribe to:
Comments (Atom)