Tuesday, December 20, 2011

The limits of mechanistic understanding

Trials and Errors: Why Science Is Failing Us uses the story of a failed drug, torcetrapib, to illustrate issues involved with understanding complex systems. It begins with a critique of mechanistic reductionism.

The story of torcetrapib is a tale of mistaken causation. Pfizer was operating on the assumption that raising levels of HDL cholesterol and lowering LDL would lead to a predictable outcome: Improved cardiovascular health. Less arterial plaque. Cleaner pipes. But that didn’t happen.
....
Pfizer invested more than $1 billion in the development of the drug and $90 million to expand the factory that would manufacture the compound. Because scientists understood the individual steps of the cholesterol pathway at such a precise level, they assumed they also understood how it worked as a whole.

This assumption—that understanding a system’s constituent parts means we also understand the causes within the system—is not limited to the pharmaceutical industry or even to biology. It defines modern science. In general, we believe that the so-called problem of causation can be cured by more information, by our ceaseless accumulation of facts. Scientists refer to this process as reductionism. By breaking down a process, we can see how everything fits together; the complex mystery is distilled into a list of ingredients.
After a discussion of the problems involved in establishing causation, the article argues that science of the past few decades has pragmatically sidestepped these problems through the use of statistics and the substitution of establishing correlation for establishing causality.

But here’s the bad news: The reliance on correlations has entered an age of diminishing returns. At least two major factors contribute to this trend. First, all of the easy causes have been found, which means that scientists are now forced to search for ever-subtler correlations, mining that mountain of facts for the tiniest of associations. Is that a new cause? Or just a statistical mistake? The line is getting finer; science is getting harder. Second—and this is the biggy—searching for correlations is a terrible way of dealing with the primary subject of much modern research: those complex networks at the center of life. While correlations help us track the relationship between independent measurements, such as the link between smoking and cancer, they are much less effective at making sense of systems in which the variables cannot be isolated. Such situations require that we understand every interaction before we can reliably understand any of them. Given the byzantine nature of biology, this can often be a daunting hurdle, requiring that researchers map not only the complete cholesterol pathway but also the ways in which it is plugged into other pathways. (The neglect of these secondary and even tertiary interactions begins to explain the failure of torcetrapib, which had unintended effects on blood pressure. It also helps explain the success of Lipitor, which seems to have a secondary effect of reducing inflammation.) Unfortunately, we often shrug off this dizzying intricacy, searching instead for the simplest of correlations. It’s the cognitive equivalent of bringing a knife to a gunfight.
The piece ends with a paragraph that links back to an earlier discussion of the role of perception in establishing causation and hints at the importance of distinguishing between the known and the unknown.
And yet, we must never forget that our causal beliefs are defined by their limitations. For too long, we’ve pretended that the old problem of causality can be cured by our shiny new knowledge. If only we devote more resources to research or dissect the system at a more fundamental level or search for ever more subtle correlations, we can discover how it all works. But a cause is not a fact, and it never will be; the things we can see will always be bracketed by what we cannot. And this is why, even when we know everything about everything, we’ll still be telling stories about why it happened. It’s mystery all the way down.

Wednesday, December 14, 2011

Economics and shifting stability states

The BBC News has an interesting collection of economic graphs from 2001 put together by top economists. My personal favorite is shown below, along with its caption.

"For a long time the perception was that the creation of the euro meant sovereign risk was effectively the same across all countries. That of course proved to be wrong. The Lehman's crisis and financial meltdown that followed affected the deficits and debt levels of different countries in different ways. Interestingly it is much the same countries now with very high yields as it was pre-euro, suggesting little has changed fundamentally in a decade." VICKY PRYCE, SENIOR MANAGING DIRECTOR FTI


Seems like a classic example of shifting stability states with interesting implications for managing socio-ecological systems if you think of the adoption of the euro as the creation of a meso-level institutional structure (larger than the individual participating states, but not encompassing the entire global economy). Conceived that way, the new institutional structure temporarily managed to equalize risk, but a distant disturbance in the larger system (the Lehman bankruptcy) undid it and shifted system control back to the higher (global) level.

Saturday, December 3, 2011

A few items of interest

Sunday, November 20, 2011

Stability is Destabalizing

A post from a couple of months ago charted the course of various post-WWII US recessions and posed the question Was there a structural change in the economy in the late 1970s - early 80s?
Over the period from the late 1950's to 1980, US macro-economic policy became better and better at managing recessions. They continued to come at roughly the same frequency, but they were shorter and shallower than the earlier ones. This could, potentially, indicate an increase in rigidity over time as US macroeconomic policy attempted to 'smooth out' the business cycle.
A recent post at Resilience Science draws attention to a similar matter and provides a nice set of links to analytic resources relative to the issue. Here is a key passage:
In complex adaptive systems, stability does not equate to resilience. In fact, stability tends to breed loss of resilience and fragility or as Minsky put it, “stability is destabilising”. Although Minsky’s work has been somewhat neglected in economics, the principle of the resilience-stability tradeoff is common knowledge in ecology, especially since Buzz Holling’s pioneering work on the subject. If stability leads to fragility, then it follows that stabilisation too leads to increased system fragility. As Holling and Meffe put it in another landmark paper on the subject titled ‘Command and Control and the Pathology of Natural Resource Management’, “when the range of natural variation in a system is reduced, the system loses resilience.” Often, the goal of increased stability is synonymous with a goal of increased efficiency but “the goal of producing a maximum sustained yield may result in a more stable system of reduced resilience”. The entire long arc of post-WW2 macroeconomic policy in the developed world can be described as a flawed exercise in macroeconomic stabilisation.

Saturday, November 12, 2011

Climate skepticism: An Anglo-Saxon phenomena?


To date, the bulk of research on media coverage of climate skeptics has centered has been done by Max Boycoff and looked at the US media. The recently released Poles Apart: The International Reporting of Climate Skepticism provides global take on the issue. The Guardian has an interesting post about the report.

Significantly, the report distinguishes among a variety of different types of skeptics
  • "trend sceptics" (who deny the warming trend)
  • "attribution sceptics" (who accept the trend, but attribute it to natural causes)
  • "impact sceptics" (who accept human causation, but claim the impacts will be beneficial or benign)
  • "policy sceptics" (who, for a variety of often political or ideological reasons, disagree with the regulatory policies being promoted to tackle climate change)
  • "science sceptics" (who – again, for a variety of reasons - believe climate science not to be trustworthy)
The report analyzed newspapers in six countries and found that the so-called "Climategate" affair received much more attention in the UK and the US than in Brazil, China, France or India and that "significantly more" sceptics are mentioned in the UK and US media than in the other four countries.

The report mentions a variety of factors relevant to the differential coverage:
Outcomes are usually determined by the interaction between internal processes or factors within newspapers (such as journalistic practices, editorial culture, or the influence of editors and proprietors as well as political ideology) and external societal forces (such as the power or presence of sceptical lobbying groups, sceptical scientists, sceptical political parties, or sceptical readers who are simply fearful of higher taxes or energy bills). An array of other factors, such as a country's energy profile, the presence of web-based scepticism, and a country's direct experience of a changing climate also play a role.

For comparison, Boycoff's recent work, which deals with primarily with the extent of climate change coverage by various media outlets around the world, is available here and in the lecture below.

Thursday, November 3, 2011

Human agency and the Euro crisis

Social systems, unlike natural systems, involve human agents who act with particular intentions. The current Euro drama illustrates this nicely. Paul Mason's 'tankist view of the Euro crisis' uses a brilliant physical analogy to clearly explain the deal that was struck a week ago:
In search of a metaphor in this crisis, I repeatedly come back to tank armour. An ultra-modern tank is almost impossible to kill because it is covered with a mixture of ceramic, textile and metal plating that is designed to disperse the incoming energy of an anti-tank projectile: laterally.
After it's done its job the armour does not look pretty, but it works - as long as you don't get hit again.

For all the criticism of the eurozone - the greyness of the political elite, the indecision, the bunga bunga etc - their strategy is not just "kicking the can down the road". It is about dispersing the energy of the debt explosion. For velocity itself is important in the kind of collision we are talking about: over-accumulated debt impacting on real world growth. If you can slow it down, a debt explosion looks like just a long, dreary recession as people pay down their borrowings.

Now to the design of the armour: the complex system being - I will not say designed, but improvised - is composed of layers.

Layer one is the Greek debt write-off. This disperses the stress away from the Greek treasury - which can no longer control its ballooning deficits - and into the EU banking system. ....

The second layer of armour is the 108bn euro bank recapitalisation programme: money from states, Far Eastern investors and the EFSF bailout fund (see below) will be used to shore up the balance sheets of the affected banks. To visualise this, again, imagine a uranium dart hitting a surface that spreads the impact - in this case across a complex fabric of financial entities stretching from Dubai to Shanghai. ...

The deepest layer of armour Europe is trying to clad itself with is the EFSF. There is 726bn euros of taxpayers money committed, which translates into 440bn euros lendable. What they are trying to do is turn that into 1.4tn euros lendable - and the Brits want even larger - by getting, again, global lenders - including China, Brazil, the IMF and Middle East Money - to lend against the 440bn: once again spreading the impact laterally. ...

At each level then, the EU response consists in taking a concentrated impact and spreading it out - across Europe, across the world, and over time.

Given that the post was written a couple days before Greece's decision to hold a referendum on the European Union aid package intended to resolve the country's debt crisis (a decision that has now been withdrawn), Mason was prescient in his observation on the limits of his physical analogy.
However, in economics as opposed to inert matter, there is the problem of people not wanting to take the hit. Right now nobody wants to admit they are even putting themselves in line to take the hit: the German parliament, the kebab-shop phobic Italian right, the IMF, the Greek people. Everybody wants someone else to take the hit.

Tuesday, October 25, 2011

Muller Confirms Climate Change

Berkeley Physicist Richard Muller and his BEST team (Berkeley Earth Surface Temperature Study) have finished their analysis of global temperature studies and have come to a startling conclusion: the Earth is warming substantially, it is largely man-made warming, and the temperature factors cited by the climate skeptics, including Anthony Watts, have at best only a marginal effect on global warming. And this is coming from a KOCH BROS. FUNDED STUDY on climate change, which was undertaken for the purpose of REFUTING the climate change thesis. Furthermore, Muller and his team found that some of the temperature data reported thus far has UNDER-reported the amount of warming that has already taken place.

"Climate Progress actually broke this story back in March — see Exclusive: Berkeley temperature study results “confirm the reality of global warming and support in all essential respects the historical temperature analyses of the NOAA, NASA, and HadCRU.” That was based on an email Climatologist Ken Caldeira sent me after seeing their preliminary results and a public talk by Muller confirming:
  • “We are seeing substantial global warming”
  • “None of the effects raised by the [skeptics] is going to have anything more than a marginal effect on the amount of global warming.”
But now the Berkeley Earth Surface Temperature Study have completed their “independent” analysis of all of the temperature stations and found a rate of warming since the 1950s as high NOAA and NASA and faster than the (much maligned) UK Hadley/CRU data:

data analysis graph

I had posted on this story back in March myself on this EcoSoc blog. My money was on Muller, who I believed was a scientist with integrity who wanted to rigorously test the climate change thesis. The kicker was that he took money from the Koch Brothers to finance the project. My hunch was that he would end up proving that the climate change deniers were wrong, that the climate really was warming, and that this would be the ultimate kick in the skeptics' crotch: using Koch Bros. money to refute their own campaign of lies and disinformation. Bravo, Dr. Muller.


Ironically, Muller even discusses the reality of peak oil, as a liquid fuel shortage, but which he believes can be replaced by compressed natural gas.

Sunday, October 23, 2011

US Govt decides Shale Gas Needs More Openness, Better Data

The Natural Gas Subcommittee for the US Energy Secretary has been tasked with "Improving the Safety & Environmental Performance of Hydraulic Fracturing" The Natural Gas Subcommittee's 90-day interim report is now available. Their 180-day final report is expected on November 18, 2011.

The subcommittee web site links to lots of interesting information, including a resources page with links to loads of useful information, transcripts of over 25000 public submissions (and, helpfully, a summary of the public comments!)

 The interim report is briefly reviewed by ScienceInsider:

The subcommittee to the secretary's Energy Advisory Board was not asked who should be regulating shale gas, Zoback says. Regulation now lies primarily with the states. But "we're pointing out what can and should be done." To regain public trust, the report says, much information about shale gas should become readily available to the public, starting with the chemical recipes for the fluids pumped at high pressure into shale to free up the gas. Those fluids sometimes spill onto the surface and into waterways. And much more information should be gathered on the environment before, during, and after drilling. The debate over whether and how drilling and fracking contaminate groundwater with gas—the infamous flaming water faucet of the documentary Gasland—would benefit especially. "We feel very strongly that having good data will advance a lot of the issues," Zoback says.

Some sort of national organization focused on shale gas should also be formed, the report says. It could create a national database of all public information as well as disseminate best practices to industry as they evolve. Added support for existing mechanisms that aid communication among state and federal regulators would also help.

"It's a remarkable report," says Philip Sharp, president of the think tank Resources for the Future in Washington, D.C. "It's a balanced, high-caliber group with public input. The report is remarkable in having honest, actionable proposals in it. What they say will get attention."

Saturday, October 22, 2011

Network Analysis of A Complex Global System: the 147 Super-Connected Corporations that Run the World


Revealed – the capitalist network that runs the world
By wmw_admin on October 21, 2011

Andy Coghlan and Debbie MacKenzie – New Scientist October 19, 2011


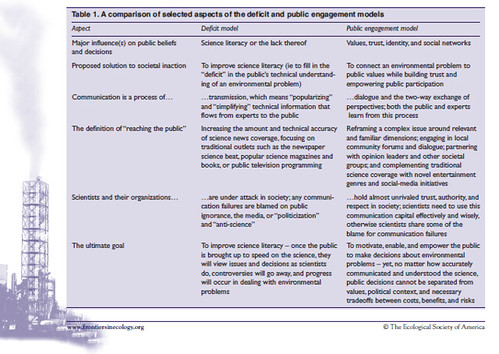
[Caption: The 1318 transnational corporations that form the core of the economy. Superconnected companies are red, very connected companies are yellow. The size of the dot represents revenue.]

AS PROTESTS against financial power sweep the world this week, science may have confirmed the protesters’ worst fears. An analysis of the relationships between 43,000 transnational corporations has identified a relatively small group of companies, mainly banks, with disproportionate power over the global economy.

The study’s assumptions have attracted some criticism, but complex systems analysts contacted by New Scientist say it is a unique effort to untangle control in the global economy. Pushing the analysis further, they say, could help to identify ways of making global capitalism more stable.

The idea that a few bankers control a large chunk of the global economy might not seem like news to New York’s Occupy Wall Street movement and protesters elsewhere (see photo). But the study, by a trio of complex systems theorists at the Swiss Federal Institute of Technology in Zurich, is the first to go beyond ideology to empirically identify such a network of power. It combines the mathematics long used to model natural systems with comprehensive corporate data to map ownership among the world’s transnational corporations (TNCs).

“Reality is so complex, we must move away from dogma, whether it’s conspiracy theories or free-market,” says James Glattfelder. “Our analysis is reality-based.”

Previous studies have found that a few TNCs own large chunks of the world’s economy, but they included only a limited number of companies and omitted indirect ownerships, so could not say how this affected the global economy – whether it made it more or less stable, for instance.

The Zurich team can. From Orbis 2007, a database listing 37 million companies and investors worldwide, they pulled out all 43,060 TNCs and the share ownerships linking them. Then they constructed a model of which companies controlled others through shareholding networks, coupled with each company’s operating revenues, to map the structure of economic power.

The work, to be published in PloS One, revealed a core of 1318 companies with interlocking ownerships (see image). Each of the 1318 had ties to two or more other companies, and on average they were connected to 20. What’s more, although they represented 20 per cent of global operating revenues, the 1318 appeared to collectively own through their shares the majority of the world’s large blue chip and manufacturing firms – the “real” economy – representing a further 60 per cent of global revenues.

When the team further untangled the web of ownership, it found much of it tracked back to a “super-entity” of 147 even more tightly knit companies – all of their ownership was held by other members of the super-entity – that controlled 40 per cent of the total wealth in the network. “In effect, less than 1 per cent of the companies were able to control 40 per cent of the entire network,” says Glattfelder. Most were financial institutions. The top 20 included Barclays Bank, JPMorgan Chase & Co, and The Goldman Sachs Group.

John Driffill of the University of London, a macroeconomics expert, says the value of the analysis is not just to see if a small number of people controls the global economy, but rather its insights into economic stability.

Concentration of power is not good or bad in itself, says the Zurich team, but the core’s tight interconnections could be. As the world learned in 2008, such networks are unstable. “If one [company] suffers distress,” says Glattfelder, “this propagates.”

“It’s disconcerting to see how connected things really are,” agrees George Sugihara of the Scripps Institution of Oceanography in La Jolla, California, a complex systems expert who has advised Deutsche Bank.

Yaneer Bar-Yam, head of the New England Complex Systems Institute (NECSI), warns that the analysis assumes ownership equates to control, which is not always true. Most company shares are held by fund managers who may or may not control what the companies they part-own actually do. The impact of this on the system’s behaviour, he says, requires more analysis.

Crucially, by identifying the architecture of global economic power, the analysis could help make it more stable. By finding the vulnerable aspects of the system, economists can suggest measures to prevent future collapses spreading through the entire economy. Glattfelder says we may need global anti-trust rules, which now exist only at national level, to limit over-connection among TNCs. Bar-Yam says the analysis suggests one possible solution: firms should be taxed for excess interconnectivity to discourage this risk.

One thing won’t chime with some of the protesters’ claims: the super-entity is unlikely to be the intentional result of a conspiracy to rule the world. “Such structures are common in nature,” says Sugihara.

Newcomers to any network connect preferentially to highly connected members. TNCs buy shares in each other for business reasons, not for world domination. If connectedness clusters, so does wealth, says Dan Braha of NECSI: in similar models, money flows towards the most highly connected members. The Zurich study, says Sugihara, “is strong evidence that simple rules governing TNCs give rise spontaneously to highly connected groups”. Or as Braha puts it: “The Occupy Wall Street claim that 1 per cent of people have most of the wealth reflects a logical phase of the self-organising economy.”

So, the super-entity may not result from conspiracy. The real question, says the Zurich team, is whether it can exert concerted political power. Driffill feels 147 is too many to sustain collusion. Braha suspects they will compete in the market but act together on common interests. Resisting changes to the network structure may be one such common interest.

The top 50 of the 147 superconnected companies

1. Barclays plc
2. Capital Group Companies Inc
3. FMR Corporation
4. AXA
5. State Street Corporation
6. JP Morgan Chase & Co
7. Legal & General Group plc
8. Vanguard Group Inc
9. UBS AG
10. Merrill Lynch & Co Inc
11. Wellington Management Co LLP
12. Deutsche Bank AG
13. Franklin Resources Inc
14. Credit Suisse Group
15. Walton Enterprises LLC
16. Bank of New York Mellon Corp
17. Natixis
18. Goldman Sachs Group Inc
19. T Rowe Price Group Inc
20. Legg Mason Inc
21. Morgan Stanley
22. Mitsubishi UFJ Financial Group Inc
23. Northern Trust Corporation
24. Société Générale
25. Bank of America Corporation
26. Lloyds TSB Group plc
27. Invesco plc
28. Allianz SE 29. TIAA
30. Old Mutual Public Limited Company
31. Aviva plc
32. Schroders plc
33. Dodge & Cox
34. Lehman Brothers Holdings Inc*
35. Sun Life Financial Inc
36. Standard Life plc
37. CNCE
38. Nomura Holdings Inc
39. The Depository Trust Company
40. Massachusetts Mutual Life Insurance
41. ING Groep NV
42. Brandes Investment Partners LP
43. Unicredito Italiano SPA
44. Deposit Insurance Corporation of Japan
45. Vereniging Aegon
46. BNP Paribas
47. Affiliated Managers Group Inc
48. Resona Holdings Inc
49. Capital Group International Inc
50. China Petrochemical Group Company

* Lehman still existed in the 2007 dataset used

Source

Sunday, October 16, 2011

Cesar Hidalgo on Economic Complexity

As evident from the voluminous discussion of the concept of biodiversity, the significance of diversity within ecosystems has long been recognized.  Generally speaking, this isn't the case in economics where the focus has typically been on identifying a small list of 'factors of production' (labor, capital, technology, etc.) and their transformation into a single comparable product ($ value). Taking a complexity view, Hidalgo and his collaborators argue that Adam Smith and Durkheim (with their emphasis on specialization and the division of labor) provide a more fruitful way of conceptualizing the economic realm.

Conceptually, as shown at the left, Hidalgo divides the countries of the world up into four groups: 1) Countries whose few major products are also produced by a number of other countries (e.g., the sugar producing countries of the Caribbean), 2) Countries with diversified economies, but all their major products are produced in a number of other locations, 3) Non-diversified economies that produce unique and exclusive products (such as Saudi Arabia and other oil based economies) and 4) Countries producing a diverse range of unique and distinct products.

Using a measure of economic complexity described in this paper, Hidalgo locates the economies of the world in a quantified representation of that basic conceptual space. Two points are worth of note. First, the countries locate themselves along a diagonal with almost every world economy being located in either the first or the fourth quadrant. As summarized by Ethan Zuckerman:
The nations that make only a few things all tend to make, more or less, the same things. Basically, we can divide the world into two sets of countries – those that have sufficient personbytes of knowledge to produce a wide range of goods, and those that can produce only a few simple things. The places that make everything make things that few others make. Hausmann explains that products require a specific set of personbytes to produce. When you gain additional personbytes of skill, it’s like getting new letters in Scrabble – you can produce a new set of words, but only within the constraints of the letters (skills, knowledge) you already have.
Second, this approach does a much better job than traditional economic analysis in addressing the classic question: "Why are some countries rich and other countries poor?" It explains 73% of the variance in income across nations.


Hidalgo describes his approach to complexity economics in the following two videos.


The same basic ideas are covered in more detail in this version.


His webpage is a wealth of information, including (among other things) pages with links to all his publications, to supporting materials for classes on complex systems, and access to the data sets used in his research.

Friday, October 14, 2011

Canadian Environmental Network unexpectedly terminated

Here's the first few lines of today's news release:

Future uncertain for network of over 640 environmental groups

Today, the Canadian Environmental Network (RCEN), one of Canada’s oldest, largest, and most well-respected democratic institutions serving the environmental concerns of all Canadians, was forced to lay off its staff and is on the verge of closing its doors and those of its 11 regional offices.
The Network demands to know why it is being shut out of communications with Environment Canada regarding the promised funding for fiscal year 2011-2012. Neither Environment Minister Peter Kent nor his departmental officials have explained why they are not delivering on their promise of continued core funding for the Network, which comprises its key environmental constituency across Canada.

“The Canadian Environmental Network received a letter from Environment Canada in May this year stating their intent to continue core funding in the amount of $547,000 for the current fiscal year. In keeping with our over three-decades-long partnership, we ask that EC honour this letter,” said Olivier Kolmel, Chair of the RCEN.

“The RCEN consists of over 640 highly diverse large and small, rural and urban organisations from coast to coast to coast. The Network forms an invaluable and irreplaceable grid of communication among environmentally concerned Canadians and the Government of Canada.
Resources for petitioning the government to reconsider are available after the break .

Thursday, October 6, 2011

Rifkin on Energy, Communications and Complex Societies


I still don't think that a distributed hydrogen grid could supply the same density of energy that fossil fuels does. I'm not convinced that distributed energy will run the kind of "global" economy that we have now (which, he is right, is in its death throes). If Rifkin followed Rifkin's own thinking, the third industrial revolution is distributed production, in which each locality produces what it needs and trades with other nearby localities. Instead of globalized agribusiness, we have small farms everywhere that produce food for a local market. I can't say with any certainty how a "distributed manufacturing system" would operate.

The biggest hole in Rifkin's thesis is that he's only talking about electricity production: he's not talking about transport energy. Electrified transportation is only good for short distances (compared with gasoline, diesel and jet fuel). Reliance on electricity for transport would be a limiting factor that would tend to localize production, and would discourage trading over long distances. And that's another reason why Rifkin's distributed energy grid won't fuel a globalized economy. But for him to leave the discussion of mobility and transport out of the discussion altogether seriously weakens his thesis. As Robert Hirsch said again recently, the peak oil crisis is a liquid fuel crisis that primarily impacts transportation.

Sunday, September 25, 2011

Review: The Inquisition of Climate Science

A post following up on the previous one, using James Powell's recently released The Inquisition of Climate Science to illustrate why science communication can't be left entirely to scientists. 

Wednesday, September 21, 2011

Should we leave science communication to scientists?

The answer is no, according to John Beasley and Matthew Nisbet's current article "How scientists view the public, the media and the political process" published in Public Understanding of Science. Here is the abstract:

We review past studies on how scientists view the public, the goals of communication, the performance and impacts of the media, and the role of the public in policy decision-making. We add to these past findings by analyzing two recent large-scale surveys of scientists in the UK and US. These analyses show that scientists believe the public is uninformed about science and therefore prone to errors in judgment and policy preferences. Scientists are critical of media coverage generally, yet they also tend to rate favorably their own experience dealing with journalists, believing that such interactions are important both for promoting science literacy and for career advancement. Scientists believe strongly that they should have a role in public debates and view policy-makers as the most important group with which to engage. Few scientists view their role as an enabler of direct public participation in decision-making through formats such as deliberative meetings, and do not believe there are personal benefits for investing in these activities. Implications for future research are discussed, in particular the need to examine how ideology and selective information sources shape scientists’ views.

The current post on Nisbet's blog discusses the article further and includes the following informative graphic summarizing the difference between the deficit model (which most scientists accept and practice) and the alternative public engagement model of science sommunication.

Sunday, September 11, 2011

Tea Party, Politics and Global Warming

A special report from the Yale Center for Climate Change Communication, Politics & Global Warming: Democrats, Republicans, Independents, and the Tea Party reports how the members of each political party respond to the issue of global warming. For people who have studied US attitudes toward climate change, most of the results are familiar. However, for the first time, this report separates the views of Tea Party members on global warming from the traditional political categories of Democrats, Republicans, and Independents. So, that's where I'll focus.

As shown in the chart below, Tea Party members are both least likely to believe in global warming and most entrenched in their opinions (feeling that they are more informed and don't need additional information to form their opinion). 
Consistent with the strength of their views, they are less likely to change their view based on empirical experience (i.e., extreme weather; specifically, either the heat wave of the summer or the snowstorms of the winter).

The public is notoriously bad at 'knowledge' questions. For example, the national average is identically split on the level of scientific consensus: 41% say most scientists think global warming is happening and 41% think there is 'a lot of disagreement among scientists'. This is, of course, an empirical issue. One can count up the views of the scientific community as Naomi Oreskes and others have done. No one did particularly well when asked "what proportion of climate scientists think that global warming
is happening?" Only 18% of Democrats and Independents got the right answer (81-100%) while 1% of Tea Party members gave that response. In contrast to all other groups, Tea Party members were more likely to understate the level of consensus (suggesting only 21-40% of climate scientists believed global warming was occurring).

There is a lot more in the report, but,  in general, three additional areas stand out:
1) Compared to the rest of the population, Tea Party members are more individualist and less egalitarian in their personal values.
2) Compared to the rest of the population, Tea Party members distrust social institutions and information sources of all types.
3) Despite these fundamental differences, there are some specific climate relevant policies that Tea Party members support in greater numbers than other groups (building more nuclear plants) or hold views generally similar to the rest of the population (funding research into renewable energy, creating bike paths/lanes, increasing availability of public transportation).

In sum, there is a strong and entrenched opposition to the way the climate debate has been framed in the US. The Tea Party members are, and will remain, able to block any 'big government' policy focused on 'global warming.' It is time to reframe the debate in terms of energy and other areas where progress is possible.

Tuesday, September 6, 2011

Was there a structural change in the economy in the late 1970s - early 80s?

(Click on the graph for a larger view.) I really don't know what to make of this graph, other than it is really interesting. My thoughts are below, feel free to share yours.

The lines trace the impact of various recessions on employment. Each color refers to a particular recession. The individual lines trace both the extent of job loss (the deeper the drop, the greater the drop in employment) and the length of time to get back to the pre-recession rate of employment (the further to the right, the longer the recovery takes).

The striking thing about the graph is that something fundamental appears to have occurred around 1980/81. If you look at the lines for the seven recessions that occurred between 1948 and 1980, they all have the same basic V shape. There is also a fairly systematic relationship between the depth of the recession, the length of time until the bottom is reached and the time until employment returns to the pre-recession level. In systemic terms, all recessions up to 1980 behaved in a generally similar fashion.

There is also a noticeable difference between the earlier V shaped recessions and the later ones. The earlier ones (1948, 1953, 1957) have very similar profiles; they were deeper (job losses of 3.4-5.2%) and longer (with 13 months until the bottom) than the later V-shaped recessions. The recessions of 1960, 1969, 1974 and 1980 were shallower (job losses of 1.3-2.7%) and shorter (between 4 and 10 months to the bottom).

The three most recent recessions (1990, 2001, 2007) have a very different profile. Rather than the sharp drop and bounce back of the V shape, the whole process appears to have slowed down. The rate of decline and the rate of recovery are both much slower and the impact of the recession on employment is much longer. The profiles of the three most recent recessions look more like a river basin than the V-shaped valley of the earlier ones. It has taken longer to reach the bottom (24 months, or almost twice as long as the 48-57 recessions) and, once there, the percentage of job losses has flat-lined for close to a year before starting to recover. 

The transition appears to have occurred in 1980/81. This is the only case where there is a double-dip recession. Moreover, where the 1980 recession looks like the smallest of the V-shaped recessions, the 1981 curve has a transitional look. Unlike any of the previous recessions, the bottom comes a few months later and flatlines for a few months before the upsurge in employment occurs. The other point of significance. Where recessions had occurred on a crude 5 year cycle up to 1980, the cycle is more like 9 or 10 years since the 81 recession. This, like the shifting shape, suggests the overall process has slowed.

As noted in an earlier post, there are other indicators that the global economy significantly changed at this time, a period linked with the early phases of economic globalization.

So, to take a shot at translating this into panarchy terms, recessions are a product of the adaptive cycle. Over the period from the late 1950's to 1980, US macro-economic policy became better and better at managing recessions. They continued to come at roughly the same frequency, but they were shorter and shallower than the earlier ones. This could, potentially, indicate an increase in rigidity over time as US macroeconomic policy attempted to 'smooth out' the business cycle. This national level process, around 1980, confronted a different dynamic -- resulting from changes to the higher (global) level cycle associated with economic globalization. In other words, the shift from one form of recession (V-shaped) to another (river-shaped) involves a cross-scale interaction where changes in the global economy (outsourcing of manufacturing and the increasing financialization of the US economy, for example) affect the ability of the US to rebound from recessions and, in particular, to create jobs.

Saturday, September 3, 2011

Budget Smog

A recent graph from the Congressional Budget Office (below) puts the US budget situation in an interesting light. Once you take the cost of running multiple wars off the books (the decade long decline in the green line) the spending side of the budget is pretty much in a steady state -- except for the cost of healthcare, which is rising dramatically.

So, you would think that environmental regulations that would limit air pollution and save billions in healthcare costs would be a good idea. Instead, as described in detail in Obama pulls back proposed smog standards in victory for business, the Obama administration has crumpled in the face of political pressure. Afraid of being labeled as responsible for "job killing regulation" during a period of high unemployment, the move effectively leaves in place 1997 era standards which even the Bush administration  admitted were lax and out of date. (The 1997 regulations were based on science showing that low-level ozone and other atmospheric pollutants contributed to various lung disease but not to death. Subsequent research has unequivocally tied such pollutants to both disease and death.)

Significantly, the regulations are, from a macro-economic perspective, effectively neutral. They would cost industry somewhere between $19 and 90 billion per year by 2020 (depending on the precise standard implemented) and would result in between $13 and 100 billion in healthcare savings. In other words, the total level of economic activity would remain the same, there would just be a shift from government expenditures on healthcare to private sector expenditures on pollution control.

Ominously,
The ozone standard is one of several air-quality rules the administration is in the process of adopting or has already finalized that are under attack. Others include new limits on mercury and air toxins, greenhouse gases from power plants, and a range of emissions from industrial boilers, oil refineries, cement plants and other sources.
This was the easy one. So the likelihood of action on the others is even less. Inaction on smog turns the big club of unilateral action on carbon emissions that the US courts gave the EPA when they ruled carbon was a pollutant into a plush toy. It is looking more and more like US environmental policy is another casualty of the divisive political culture. Return to slow and costly litigation in the courts may be the necessary path


Tuesday, August 30, 2011

A brief meditation on science, democracy and complexity

A recent article in the Ventura County Reporter, Our Ocean: As Healthy as it Looks?, does a nice job of contrasting public perception (the ocean looks great from Highway 101, the fishing is good, altogether it seems pretty healthy) with a series of scientific reports predicting environmental catastrophe due to ocean acidification, rising global carbon emissions, overfishing, pollution and a variety of other factors.

What accounts for the differing views of scientists and the public? And why is the situation likely to get much worse? Read on after the jump ...

Friday, August 26, 2011

It was 45 years ago today ....

The world's first view of Earth taken by a spacecraft from the vicinity of the moon. The photo was transmitted to Earth by the United States Lunar Orbiter I and received at the NASA tracking station near Madrid. This crescent of the Earth was photographed August 23, 1966 when the spacecraft was on its 16th orbit and just about to pass behind the moon.

Lots of people are familiar with the later, color version, taken by the Apollo astronauts a few years later. The emotional impact of the more famous image -- a blue/living planet set again the black/lifeless moon -- is undeniably greater ... but this is the original.

Thursday, August 25, 2011

Robyn O'Brien on Food

Robyn O'Brien authored “The Unhealthy Truth: How Our Food Is Making Us Sick and What We Can Do About It.” A former Wall Street food industry analyst, Robyn brings insight, compassion and detailed analysis to her research into the impact that the global food system is having on the health of our children. She founded allergykidsfoundation.org and was named by Forbes as one of “20 Inspiring Women to Follow on Twitter.” The New York Times has passionately described her as “Food’s Erin Brockovich.”

Wednesday, August 17, 2011

Gail the Actuary Tells it Like it Is

Here's another brilliant summary of our current global economic and energy situation by Gail the Actuary. It's a synopsis of the peak oil thesis and how it plays out as a 'growth ceiling' and economic decline. It doesn't even take into account catastrophic environmental crises caused by climate change (storms, floods, droughts, fires), causing mass migration, starvation and conflict, but that would be almost too much to contemplate at once. What I love most about Gail's presentation is that she finally concludes that "there is no solution." This is the conclusion I came to almost a year ago. When you put the whole ball of wax together, you have to face that fact that there really is no solution. Solutions that work for one complex set of arrangements tend to wreak havoc somewhere else. And there doesn't seem to be any set of solutions that can forestall even a partial collapse of the world's economy. That's either a 'bad thing' or a 'good thing' depending on what is collapsing and whether you're invested in keeping the whole system going. What is collapsing is globalized Capitalist civilization, and frankly, I'm not sorry to see it go.

Included in the presentation is a series of nifty charts and graphs. The most troubling, though, is the graph which shows a strong correlation between oil prices and the price of food.

Monday, August 15, 2011

Ecological Mayhem as Economic Opportunity

Can Jeremy Grantham Profit From Ecological Mayhem? analyzes the neo-Malthusian outlook of financial guru Jeremy Grantham, manager of $150 billion in investments, author of a financial newsletter with a wide following and benefactor to The Grantham Foundation for the Protection of the Environment

Grantham argues that the late-18th-century doomsayer Thomas Malthus pretty much got it right but just had the bad timing to make his predictions about unsustainable population growth on the eve of the hydrocarbon-fueled Industrial Revolution, which “partially removed the barriers to rapid population growth, wealth and scientific progress.” That put off the inevitable for a couple of centuries, but now, ready or not, the age of cheap hydrocarbons is ending. Grantham’s July letter concludes: “We humans have the brains and the means to reach real planetary sustainability. The problem is with us and our focus on short-term growth and profits, which is likely to cause suffering on a vast scale. With foresight and thoughtful planning, this suffering is completely avoidable.”
...
While it may be too late to “gracefully” deal with depleted resources­, climate change and related crises, it’s never too late to mitigate the damage. And, crucially, the consequences will be unevenly distributed, creating angles for you to make money and look out for your interests, however you define them.
 
Grantham has a fairly standard Malthusian take on the future and an interesting recognition of his status: “The rather burdensome thought is that people won’t listen to environmentalists, but they will sometimes listen to people like me.” Building on this, Grantham thinks economics rather than politics may be the way to address climate change -- particularly for the US. “People are naturally much more responsive to finite resources than they are to climate change. Global warming is bad news. Finite resources is investment advice.” He believes this shift in emphasis plays to Americans’ strength. “Americans are just about the worst at dealing with long-term problems, down there with Uzbekistan, but they respond to a market signal better than almost anyone. They roll the dice bigger and quicker than most.” Grantham says that corporations respond well to this message because they are “persuaded by data,” but American public opinion is harder to move, and contemporary American political culture is practically dataproof.

Here's his assessment of the standard litany of potential problems.
Energy “will give us serious and sustained problems” over the next 50 years as we make the transition from hydrocarbons — oil, coal, gas — to solar, wind, nuclear and other sources, but we’ll muddle through to a solution to Peak Oil and related challenges. Peak Everything Else will prove more intractable for humanity. Metals, for instance, “are entropy at work . . . from wonderful metal ores to scattered waste,” and scarcity and higher prices “will slowly increase forever,” but if we scrimp and recycle, we can make do for another century before tight constraint kicks in.


Agriculture is more worrisome. Local water shortages will cause “persistent irritation” — wars, famines. Of the three essential macro nutrient fertilizers, nitrogen is relatively plentiful and recoverable, but we’re running out of potassium and phosphorus, finite mined resources that are “necessary for all life.” Canada has large reserves of potash (the source of potassium), which is good news for Americans, but 50 to 75 percent of the known reserves of phosphate (the source of phosphorus) are located in Morocco and the western Sahara. Assuming a 2 percent annual increase in phosphorus consumption, Grantham believes the rest of the world’s reserves won’t last more than 50 years, so he expects “gamesmanship” from the phosphate-rich.

And he rates soil erosion as the biggest threat of all. The world’s population could reach 10 billion within half a century — perhaps twice as many human beings as the planet’s overtaxed resources can sustainably support, perhaps six times too many.
And why he thinks the results of the famous Ehrlich-Simon bet didn't really settle the matter; if we extend the original bet past its arbitrary 10-year limit to the present day, Ehrlich wins the five-commodity bet 4-1, and he wins big if the bet is further extended to all important commodities.
“The prices of all important commodities except oil declined for 100 years until 2002, by an average of 70 percent. From 2002 until now, this entire decline was erased by a bigger price surge than occurred during World War II. Statistically, most commodities are now so far away from their former downward trend that it makes it very probable that the old trend has changed — that there is in fact a Paradigm Shift — perhaps the most important economic event since the Industrial Revolution.”
When prices go up and stay up, it’s not a bubble. Prices may always revert to the mean, but the mean can change; that’s a paradigm shift. As Grantham tells it, oil went first. For a century it steadily returned to about $16 a barrel in today’s currency, then in 1974 the mean shifted to about $35, and Grantham believes it has recently doubled again. Metals and nearly everything else — coal, corn, palm oil, soybeans, sugar, cotton — appear to be following suit. “From now on, price pressure and shortages of resources will be a permanent feature of our lives,” he argues. “The world is using up its natural resources at an alarming rate, and this has caused a permanent shift in their value. We all need to adjust our behavior to this new environment. It would help if we did it quickly.”

Saturday, August 13, 2011

Stephen Colbert's SuperPak promotes Rick Perry. No I mean Rick Parry

In the interest of the 24 hour news cycle and all things political, its time to analyze the significance of the first foray into the political realm by Stephen Colbert's superpak, Americans for a Better Tomorrow Tomorrow. The last couple days, these two ads have aired in Iowa.


So, what's up? Why would Colbert have targeted Perry and, in particular, drawn attention to his candidacy and asked people to write in the misspelled name of Rick Parry? And why pick the rather obscure venue of the Iowa straw poll? Answers after the jump ... so read on.

Thursday, August 11, 2011

Global Economy: Are we approaching Peak Standard of Living?

Back in 1956, M. King Hubbert advanced the basic idea behind peak oil theory: the recognition that for any given geographical area, from an individual oil-producing region to the planet as a whole, the rate of petroleum production tends to follow a bell-shaped curve. For example, the chart contrasts Hubbert's prediction for the continental US against observed data. The implications of the idea -- that once a peak occurs the slide downward is inexorable and unstoppable -- have resulted in lots of attempts to determine the peaks of various regions and the globe as a whole.


Hubbert, while famous for applying the idea to oil, viewed it as a process applicable to a wide variety of natural resources. Indeed, he got the idea from an study of coal resources done in the 1920's. Thus, not surprisingly, the idea has spread to other areas. The most expansive treatment occurs in Richard Heinberg's Peak Everything: Waking Up to the Century of Declines which argues that the twenty-first century ushered in an era of declines, in a number of crucial parameters.

While peak oil types have spent lots of time and energy examining the relationship between energy and the economy, the bulk of the analyses are similar to this (where they measure economic activity in terms of gross domestic product (GDP) or this (where economic drivers such as productivity are the focus). But, at the experiential level of the individual, a much better approximation of the key economic measure is not total GDP but GDP per capita (per person).

What follows are figures calculated from Angus Maddison's annual data for worldwide GDP. They show that, despite the rapid expansion of the BRIC economies, the global rate of economic growth since 1974 is LESS than it was from 1951-1973.


per capita GDP growth rate
Years
World Average
         World,           excluding China
1951
- 1973
2.9%
3.0%
1974
- 2003
1.6%
1.1%


1951
- 1960
2.8%
2.7%
1961
- 1970
3.0%
3.1%
1971
- 1973
3.1%
3.2%
1974
- 1980
1.4%
1.3%
1981
- 1990
1.3%
1.0%
1991
- 2000
1.6%
1.1%
2001
- 2003
2.5%
1.0%

So we see that GDP per head grew at a pretty constant average annual rate of about 3% per year through 1973. Toward the end of 1973, the global crisis erupted. Since that point, GDP per head has again grown at a pretty constant average annual rate. But that rate of growth is only slightly more than half the rate during the postwar boom, or slightly more than 1/3 the rate during the postwar boom if China (with its dubious official economic data) is excluded.

What the data show is a clear slowing in the rate of growth -- the global standard of living is still increasing (the values are still positive), but the rate of increase in per capita GDP is less than it was prior to 1974. Placed in the context of peak oil theory, this suggests that the global economy -- understood as the average global standard of living -- is nearing its peak.If you look at the graph above, you will see an S shape leading up to the peak -- growth begins slow, then there is a period of rapid growth (where the curve rises steeply) and, just before the peak, you get another inflection (change in the rate) as the curve flattens out near the peak. It is this flattening out immediately prior to the peak that Maddison's data captures.

(Technical note:  Angus Maddison's annual data for worldwide GDP, which span the 1950-2003 period, are available at www.ggdc.net/maddison/Historical_Statistics/horizontal-file_03-2007.xls. Maddison is the world's foremost expert on economic growth and its measurement. His GDP figures are measured in 1990 international dollars (Geary-Khamis dollars). Above, the average annual growth rate for each period is the mean of the annual growth rates; the results are almost identical if one estimates a continuous growth rate throughout the period based on the start-of-period and end-of-period figures.)

Tuesday, August 9, 2011

Panarchy, the President, and a Whack-a-mole approach to countering terrorism

The Foreign Policy article Mission Not Accomplished disputes the claim by US Secretary of Defense Leon Panetta that al Qaeda's defeat is "within reach."
Although U.S. counterterrorism efforts have indeed substantially weakened the organization, Panetta's comments miss the bigger point about the terrorist threat facing the United States. Over the past decade, that threat has morphed from one led by a hierarchical al Qaeda organization into something much more diffuse, with a greater presence online, that no longer depends on orders from senior leaders in Pakistan.
...
Viewing the terrorism threat as solely embodied by al Qaeda as a discrete and hierarchical organization is both inaccurate and dangerous. The more important metric is the popularity of the Islamist movement generally and the jihadi movement specifically. Although it is difficult to measure, its online presence has undoubtedly grown rapidly over recent years. The jihadists' media capabilities have expanded considerably over the past 10 years, and that content can easily be found across the Internet, even on the most mainstream of websites.
...
Al Qaeda as we knew it 10 years ago may be no more. But at the rate it has been adapting, it seems likely the United States will be at war with this enemy for another decade. Whether individuals can be mobilized by AQAP's media or that of other jihadi outfits to carry out effective attacks on the United States without training overseas is the most important question in counterterrorism and will likely remain so for years to come.
...
On Aug. 3 the White House took a good first step in creating a framework to counter violent jihad, in releasing "Empowering Local Partners to Prevent Violent Extremism." But it is just that: a framework. Ten years after 9/11, this document marks the U.S. government's first concerted policy effort at countering radicalization. Certainly, it is coming years too late, but it is also short on detail and built largely around the concept of community engagement. Community engagement has been the centerpiece of British and Australian efforts to counter radicalization for at least the last four years. What those programs lacked was an element that confronted the ideology of militant Islam, at the national level and online. Emphasizing local community efforts is a logical endeavor, but the jihadi message is global and focused on Muslim suffering abroad, not on local issues in London, Melbourne, or Chicago. Eventually, Washington will have to confront the underlying ideology of militant Islam, not just its byproducts.

In other words, Al Qaeda hasn't decentralized so much as it has franchised. There remains a global ideology. Or, in panarchy terms, the network has presence at the local level (individual cells), the national level (loose network within a particular region) and the global level (typically more in terms of ideology than direct interpersonal contact). As the article points out, the focus on (local) community engagement fails to confront the ideology of militant Islam either at the national level or online.  Or, to render the problem in panarchy terms, the approach omits consideration of cross-scale interactions -- particularly the remember interaction whereby lower-level processes (local organization) are rejuvenated through access to resources from the higher levels. In practical terms, you can't only play whack-a-mole at the local level and be successful.

Monday, August 8, 2011

Bodies, Big Brains and Regulatory Reform

When I started this post, it was just a listing of two things I found interesting. Then I realized they were connected. So... what are the two articles?

  1. A Body Fit for a Freaky-Big Brain, summarizing research on the anatomical adaptations necessary to accommodate our over sized brains -- which use 20 times as much energy per pound as muscle tissue. Among the factors identified: reduction in the amount of gut tissue (also very energy intensive); shifting of diet to a higher energy cuisine based on seeds, tubers and meats; and a genetic adaptation in glucose transporters that resulted in extra molecular pumps to funnel sugar into the brain, while starving muscles by giving them fewer transporters.
  2. Individuals interested in takes on the financial collapse will want to check out Capital Inadequacies The Dismal Failure of the Basel Regime of Bank Capital Regulation. Put out by the libertarian Cato Institute, the paper provides 40 pages or so of analysis aimed at a) documenting that regulatory solutions to financial matters are misplaced because regulatory apparatus is subject to capture and b) advocating a solution based on financial laissez faire.
The solution is free banking or financial laissez faire. The state would withdraw entirely from the financial system and, in particular, abolish capital adequacy regulation, deposit insurance, financial regulation, and the central bank, as well as repudiate future bailouts (and especially the doctrine of Too Big to Fail). ... Such systems have worked well in the past, and reforms along these lines would take the United States a long way back to its banking system of a century ago, in which banks were tightly governed and moral hazards and risk taking were well controlled because those who took the risks bore their consequences.

Now we can debate the empirical validity of these claims -- the individuals who lost all their savings in the bank runs of the Great Depression probably wouldn't agree that "those who took the risks bore their consequences" -- but that isn't the point.

Compare the view of systems and adaptation in the two scenarios. In the first article the "system" is the human body. The basic argument is that modification of one major subsystem (the brain) necessitated modification to other parts of the system in order for the "big brained" version of humans to survive. Contrast this with the view of the economic system advanced in the Cato Institute analysis. Over the past century the economy has changed dramatically. The growth of financial services as the mainstay of many advanced economies is the equivalent of the emergence of big brains -- one particular part of the system is becoming unusually important. A century ago, advanced economies were based on manufacturing and agriculture. Today, these sectors play a comparatively minor role and financial services (conventionally rendered as Wall Street) rule. But, rather than recognizing that change in one part of the system requires an adjustment in other parts of the system, the Cato paper argues for stability in the other aspects of the system (as expressed in the desire for a banking system similar to what was in place in 1910).

There is also a confusion Cato Institute paper about the role of organization (regulation) as it characterizes complex systems, but getting into that would be another (lengthy and necessarily technical) post.

Saturday, August 6, 2011

Oh Canada, and other quick takes

  1. The Guardian reports on unprecedented lobbying efforts by the Canadian government aimed at maintaining an export market for oil from the tar sands.
    The lobbying effort, which includes dozens of meetings between Canadian and British government "representatives" and oil executives, was triggered by the release of a consultation document in July 2009 by the European commission, which attempted to definitively assess the "well-to-wheels" carbon intensity of different oils. The document attributed a "default" carbon value for traditional fuels of 85.8g of carbon dioxide per mega joule of energy for traditional oil and 107gCO2/MJ for fuel derived from tar sands.
    The Canadians have managed to delay the EU's original deadline of January 2011 for confirming baseline default values despite new peer-reviewed studies to support the European position. Darek Urbaniak, extractives campaign coordinator at Friends of the Earth Europe, said: "It is unprecedented that a government of one of the most developed countries can devise and implement a strategy that involves undermining independent science and deliberate misleading of its international partners."
  2.  Andrew Revkin has an interesting summary of material related to the Somalia famine in A Climate Scientist's view of a Famine's Roots. Among the problems identified -- a faulty IPCC projection.
    Funk says the 2007 projection of wetter conditions led some agencies to plan the expansion of agriculture in the region — plans that could be devastated if drier conditions prevail, as his work implies.
  3.  Individuals interested in collapse will want to click their way over to Foreign Policy -- where the current issue has several articles on the collapse of the Soviet Union, including the cover story Everything You Think You Know About the Collapse of the Soviet Union Is Wrong. And why it matters today in a new age of revolution.

Thursday, August 4, 2011

Padgett, Part III: Autocatalysis in the Economy and in Persons

This is the third in a series dealing with one of the most interesting ideas I've come across in a decade: the theory outlined in John Padgett's The Emergence of Markets and Organizations. For an overview of the book and description of the network perspective, see Part I. Part II provides a concrete illustration of the approach, the emergence of the partnership structure in Renaissance Italy. This  post summarizes the chemical process (autocatalysis) that Padgett uses as a conceptual model for understanding the production of goods and people. This post begins with a description of autocatalytic networks in chemistry and then applies the concept to economic production and, finally, to the production of persons.