Hubbert, while famous for applying the idea to oil, viewed it as a process applicable to a wide variety of natural resources. Indeed, he got the idea from an study of coal resources done in the 1920's. Thus, not surprisingly, the idea has spread to other areas. The most expansive treatment occurs in Richard Heinberg's Peak Everything: Waking Up to the Century of Declines which argues that the twenty-first century ushered in an era of declines, in a number of crucial parameters.
While peak oil types have spent lots of time and energy examining the relationship between energy and the economy, the bulk of the analyses are similar to this (where they measure economic activity in terms of gross domestic product (GDP) or this (where economic drivers such as productivity are the focus). But, at the experiential level of the individual, a much better approximation of the key economic measure is not total GDP but GDP per capita (per person).
What follows are figures calculated from Angus Maddison's annual data for worldwide GDP. They show that, despite the rapid expansion of the BRIC economies, the global rate of economic growth since 1974 is LESS than it was from 1951-1973.
per capita GDP growth rate | ||||
Years | World Average | World, excluding China | ||
1951 | - | 1973 | 2.9% | 3.0% |
1974 | - | 2003 | 1.6% | 1.1% |
1951 | - | 1960 | 2.8% | 2.7% |
1961 | - | 1970 | 3.0% | 3.1% |
1971 | - | 1973 | 3.1% | 3.2% |
1974 | - | 1980 | 1.4% | 1.3% |
1981 | - | 1990 | 1.3% | 1.0% |
1991 | - | 2000 | 1.6% | 1.1% |
2001 | - | 2003 | 2.5% | 1.0% |
So we see that GDP per head grew at a pretty constant average annual rate of about 3% per year through 1973. Toward the end of 1973, the global crisis erupted. Since that point, GDP per head has again grown at a pretty constant average annual rate. But that rate of growth is only slightly more than half the rate during the postwar boom, or slightly more than 1/3 the rate during the postwar boom if China (with its dubious official economic data) is excluded.
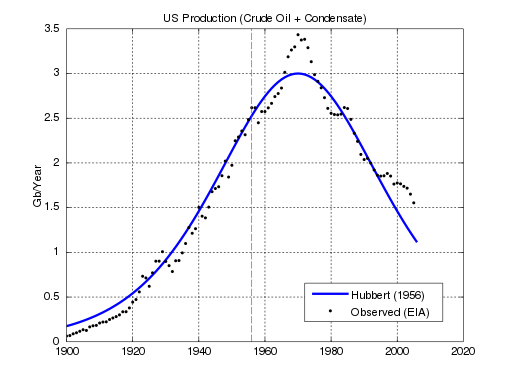
What the data show is a clear slowing in the rate of growth -- the global standard of living is still increasing (the values are still positive), but the rate of increase in per capita GDP is less than it was prior to 1974. Placed in the context of peak oil theory, this suggests that the global economy -- understood as the average global standard of living -- is nearing its peak.If you look at the graph above, you will see an S shape leading up to the peak -- growth begins slow, then there is a period of rapid growth (where the curve rises steeply) and, just before the peak, you get another inflection (change in the rate) as the curve flattens out near the peak. It is this flattening out immediately prior to the peak that Maddison's data captures.
(Technical note: Angus Maddison's annual data for worldwide GDP, which span the 1950-2003 period, are available at www.ggdc.net/maddison/Historical_Statistics/horizontal-file_03-2007.xls. Maddison is the world's foremost expert on economic growth and its measurement. His GDP figures are measured in 1990 international dollars (Geary-Khamis dollars). Above, the average annual growth rate for each period is the mean of the annual growth rates; the results are almost identical if one estimates a continuous growth rate throughout the period based on the start-of-period and end-of-period figures.)
Thank yoou
ReplyDelete